
Mathematics Project
Class:10 Date
of submission:07/07/09
_____________________________________________________________
General
Instructions:
-
The project
should be hand written
-
Credit will be
given to original and creative use of material/pictures/drawings/methods of
illustrating
-
The project must
be presented in a neatly bound simple folder.
-
Your last page
should be

Name: Class
Roll No.
Assessment of the project work:
|
Identification and
statement of project |
|
|
Design of project |
|
|
Procedure adopted |
|
|
Write up of project |
|
|
Interpretation of
result |
|
Total
Any one of the
following projects may be chosen
Project Assignment
Think of a question that asks about a cause and effect relationship between two measurable quantities. (eg.. does fingernail length affect typing speed?)
1. Write two different "how does _____ affect _____" questions.
2. Select the question that makes the most sense to you and explain why you have chosen it.
3. Write a hypothesis to answer your question.
4. Graph your data using appropriate choices of scales and axis.
5. In pencil, draw your "best" line.
6. Find the equation of your line.
Respond to the following questions
7. What do the variables in your equation represent? What does the equation represent?
8. Was your data positively correlated, negatively correlated or neither? Give possible explanations for the relationships or absence of relationships that you see in the data.
9. Use your equation to predict two data points not represented by the data. How good do you think these estimates are? why?
10. What information does the slope indicate?
Present your findings in a 3-4 pages handwritten report. Graph must be included.
B) Integer trains
You can use rods of integer sizes to build
"trains" that all share a common length. A "train of length
5" is a row of rods whose combined length is 5. Here are some examples:
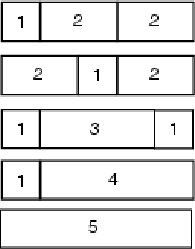
Notice that the 1-2-2 train and the 2-1-2 train contain the
same rods but are listed separately. If you use identical rods in a different
order, this is a separate train.
· How many trains of length 5 are there?
· Repeat for length 6
· Repeat for length 7
· Come up with a formula for the number of trains of length n. (Assume you have rods of every possible integer length available.) Prove that your formula is correct.
· Come up with an algorithm that will generate all the trains of length n.
· Create trains of lengths 6,7. Record any findings, conclusions in 3-4 pages of handwritten work.
C) Area of an Arbelos
Objective
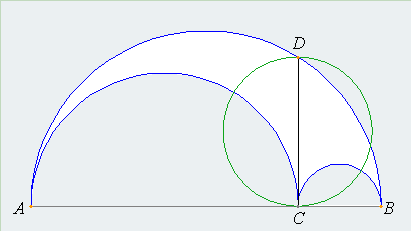
Objective: Prove that the area of the arbelos (white shaded region) is equal to the area of circle CD.
What is an arbelos?
The arbelos is the white region in the figure, bounded by three semicircles.
The diameters of the three semicircles are all on the same line segment, AB, and each semicircle is tangent to the other two. The arbelos has been studied by mathematicians since ancient times, and was named, apparently, for its resemblance to the shape of a round knife (called an arbelos) used by leatherworkers in ancient times.
An interesting property of the arbelos is that its area is equal to the area of the circle with diameter CD.
CD is along the line tangent to semicircles AC and BC (CD is thus perpendicular to AB). C is the point of tangency, and D is the point of intersection with semicircle AB.
Can you prove that the area of circle CD equals the area of the arbelos?
To do this project, you should do research that enables you to use the following terms and concepts:
- right triangles,
- circumscribing a circle about a triangle,
- similar triangles,
- area of a circle,
- Tangents are perpendicular to radii at the point of contact.
Materials and Equipment
For the proof, you'll need :
- pencil,
- paper,
- compass, and
- straight edge.
Experimental Procedure
- Do your background research,
- Organize your known facts, and
- Spend some time thinking about the problem and you should be able to come up with the proof.
- Present your findings in a 3-4 pages handwritten report.
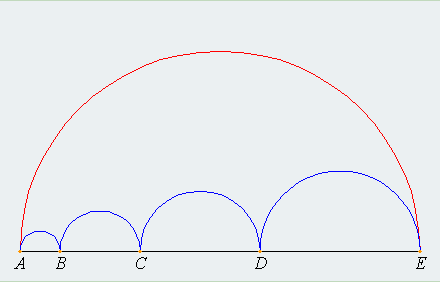
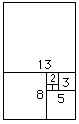
D) Perimeters of Semi Circles
Objective
The objective of this project is to prove that the sum of the perimeters of the inscribed semicircles is equal to the perimeter of the outside semicircle.
Introduction
The figure below shows a semicircle (AE) with a series of smaller semicircles (AB, BC, CD, DE,) constructed inside it. As you can see, the sum of the diameters of the four smaller semicircles is equal to the diameter of the large semicircle. The area of the larger semicircle is clearly greater than the sum of the four smaller semicircles. What about the perimeter?
Your goal is to prove that the sum of the perimeters of the inscribed semicircles is equal to the perimeter of the outside semicircle.
Materials and Equipment
- For the proof, you'll need :
- pencil,
- paper,
- compass, and
- straight edge.
- Here's a suggestion for your display: in addition to your background research and your proof, you can make a model of the Figure with colored paper. Use a compass and straightedge to construct the semicircles. Cut pieces of string or yarn equal to the arc-lengths of the semicircles. You can use these to demonstrate that the perimeter lengths are indeed equal. Repeat for 3 different measurements of semi circles.
Experimental Procedure
- Do your background research,
- Organize your known facts,
- Perform the experiments for 3 different semi circles
- Tabulate your findings
- Mathematically prove the result
- Present your work in 3-4 handwritten pages.
E) Golden Ratio
In
Mathematics and the Arts, two quantities are in the golden ratio if the ratio
between the sum of those quantities and the larger one is the same as the ratio
between the larger one and the smaller. The golden ratio is approximately
1.6180339887.
Eg 1, 1, 2, 3, 5, 8, 13, 21, 34,
. . .
Let
us consider 5, 8
5 + 8 = 13
13 ![]() 8 =
1.6 approx.
8 =
1.6 approx.
8 ![]() 5 =
1.6
5 =
1.6
This sequence of numbers is known as the Fibonacci sequence
Let's build an approximation
of the golden rectangle using square grid paper.. At each step we will
calculate the ratio of length to width. Remember the Golden Ratio is
approximately 1.61803.
Step 1: Start with a square 1
by 1.
|
|
Ratio
Step 2:
Add another 1 by 1 square.
|
|
|
Ratio
Step 3:
Add a 2 X 2 square.
|
|
|
|
|
|
|
|
|
Ratio
Step 4:
Add a 3 X 3 square.
|
|
|
|
|
|
|
|
|
|
|
|
|
|
|
|
|
|
Ratio
Step 5:
Add a 5 X 5 square.
|
|
|
|
|
|
|
|
|
|
|
|
|
|
|
|
|
|
|
|
|
|
|
|
|
|
|
|
|
|
|
|
|
|
|
|
|
|
|
|
|
|
|
|
|
|
|
|
Ratio
Step 6:
It's Your Turn! Build the next approximation on square grid paper
.
Then observe the pattern and
answer the following:
- Lengthn =
- Lengthn + widthn =
- The lengths of the various rectangles are 1, 2, 3, 5,..., Notice
that each term is found by adding the 2 previous ones, the sequence known
as the -----------
- Every step of the rectangle will produce a ratio closer and closer
to the golden ratio of approximately
Which things
around you are made in the golden ratio?
Measure the
following with a centimeter measuring tape or stick. (Round
measurements to the nearest .5 cm.) Then rank the items from closest (1)
to the golden ratio to least close (4).
|
|
|
Find an item that has a ratio even closer to
the golden ratio. List its dimensions and ratio below.
|
Item Measured |
Length(cm) |
Width(cm) |
Ratio(L:W) |
|
|
|
|
|
Challenge Problem
Take an 8 1/2 X 11 inch sheet of paper.
Measure and make a golden rectangle by making one straight cut. Give the
dimensions of all possible golden rectangles you could cut from
this sheet of paper
.
F) Fibonacci
numbers and the Golden Number
If we take the ratio of two
successive numbers in Fibonacci's series, (1, 1, 2, 3, 5, 8, 13, ..) and we divide each by the number before it, we will
find the following series of numbers:
1/1 = 1, 2/1
= 2, 3/2 = 1·5, 5/3
= 1·666..., 8/5 = 1·6, 13/8 = 1·625, 21/13 = 1·61538...
It is easier to see what is
happening if we plot the ratios on a graph:
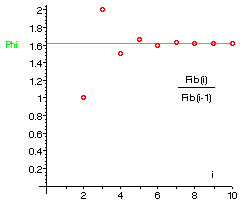
The ratio seems to be
settling down to a particular value, which we call the golden ratio or the
golden number. It has a value of approximately 1·618034
, although we shall find an
even more accurate value .
Experiment :
What happens if we take the ratios the other way round i.e. we
divide each number by the one following it: 1/1, 1/2, 2/3, 3/5, 5/8,
8/13, ..?
Use your calculator and perhaps plot a graph of these ratios and see if
anything similar is happening compared with the graph above.
You'll have spotted a fundamental property of this ratio when you find the
limiting value of the new series!
|
The golden ratio
1·618034 is also called the golden section or the golden mean or
just the golden number. It is often represented by a Greek letter Phi ![]() . The closely related value which we
write as phi with a small "p" is just the decimal part of Phi,
namely 0·618034.
. The closely related value which we
write as phi with a small "p" is just the decimal part of Phi,
namely 0·618034.
Fibonacci
Rectangles and Shell Spirals
 We can make another picture showing
the Fibonacci numbers 1,1,2,3,5,8,13,21,.. if we start with two small squares of size 1 next to each
other. On top of both of these draw a square of size 2 (=1+1).
We can make another picture showing
the Fibonacci numbers 1,1,2,3,5,8,13,21,.. if we start with two small squares of size 1 next to each
other. On top of both of these draw a square of size 2 (=1+1).
We can now draw a new
square - touching both a unit square and the latest square of side 2 - so
having sides 3 units long; and then another touching both the 2-square and the
3-square (which has sides of 5 units). We can continue adding squares around
the picture, each new square having a side which is
as long as the sum of the latest two square's sides. This set of rectangles
whose sides are two successive Fibonacci numbers in length and which are
composed of squares with sides which are Fibonacci numbers, we will call the Fibonacci
Rectangles.
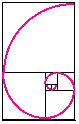 Here is a spiral drawn in the squares, a quarter of a
circle in each square. The spiral is not a true mathematical spiral
(since it is made up of fragments which are parts of circles and does not go on
getting smaller and smaller) but it is a good approximation to a kind of spiral
that does appear often in nature. Such spirals are seen in the shape of shells
of snails and sea shells and, as we see later, in the arrangement of seeds on
flowering plants too. The spiral-in-the-squares makes a line from the centre of
the spiral increase by a factor of the golden number in each square. So points on the spiral are 1.618 times as far from the centre
after a quarter-turn. In a whole turn the points on a radius out from
the centre are 1.6184 = 6.854 times further out than when
the curve last crossed the same radial line.
Here is a spiral drawn in the squares, a quarter of a
circle in each square. The spiral is not a true mathematical spiral
(since it is made up of fragments which are parts of circles and does not go on
getting smaller and smaller) but it is a good approximation to a kind of spiral
that does appear often in nature. Such spirals are seen in the shape of shells
of snails and sea shells and, as we see later, in the arrangement of seeds on
flowering plants too. The spiral-in-the-squares makes a line from the centre of
the spiral increase by a factor of the golden number in each square. So points on the spiral are 1.618 times as far from the centre
after a quarter-turn. In a whole turn the points on a radius out from
the centre are 1.6184 = 6.854 times further out than when
the curve last crossed the same radial line.
Cundy and
Rollett (Mathematical Models, second edition 1961, page 70) say that this
spiral occurs in snail-shells and flower-heads referring to D'Arcy Thompson's On
Growth and Form probably meaning chapter 6 "The Equiangular
Spiral". Here Thompson is talking about a class of spiral with a constant
expansion factor along a central line and not just shells with a Phi expansion
factor.
Below are images of cross-sections of a Nautilus sea shell. They show the
spiral curve of the shell and the internal chambers that the animal using it
adds on as it grows. The chambers provide buoyancy in the water. Click on the
picture to enlarge it in a new window. Draw a line from the centre out in any
direction and find two places where the shell crosses it so that the shell
spiral has gone round just once between them. The outer crossing point will be
about 1.6 times as far from the centre as the next inner point on the line
where the shell crosses it. This shows that the shell has grown by a factor of
the golden ratio in one turn.